So you've read our last blog post about all the figures you need to feed into our buy-to-let profit calculator, filled it in and got your results. But what do they mean? Keep reading to find out.
Let's go through the results one section at a time.
Your Investment

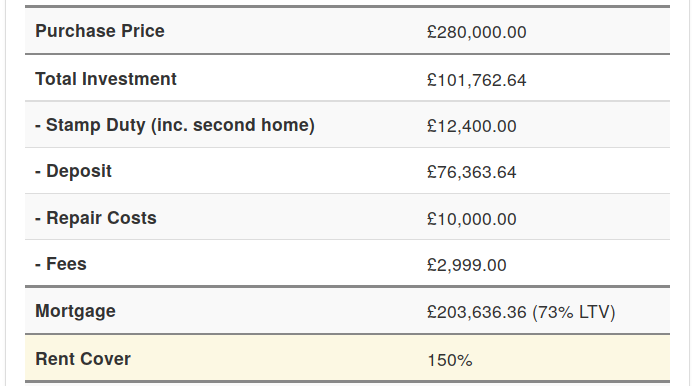
You should recognise a few of these as figures that you provided to the calculator. These are repeated back for easy reference and so you can see how they're connected. "Purchase Price", "Repair Costs" and "Fees" are the ones that should be familiar so I'll just go over the others.
Total Investment
This is the amount of actual cash you'll need to put into the purchase. The elements that make it up are shown underneath, each indented a little.
Look here first to see if you can actually afford the deal you're considering. If this number is bigger than your bank balance, things are going to be tricky.
If you included a "Cash Available" figure in the calculator inputs, this will match.
Stamp Duty
The calculated SDLT that's due on the purchase price, including the 3% second home addition. You can see all the detail on how stamp duty is calculated and grab an Excel version from our past post.
Deposit
The cash you'll actually be putting into the house itself. This is either calculated as everything spare from your "Cash Available", after other deductions; or it's the minimum amount your mortgage restrictions will allow.
Mortgage
The amount you're going to end up borrowing from your mortgage provider. Also shown is what that equates to as a LTV percentage.
This row will be yellow if LTV is the restricting factor on how much you can borrow. Or red if you've set a "Cash Available" which isn't high enough to satisfy the LTV required.
Rent Cover
“Rent cover” or “rental cover” are a relatively new restriction that’s being placed on buy-to-let mortgages.
The value shown is the percentage of the mortgage (at the stress interest rate) that the rental income is.
This row will be yellow if rent cover is the restricting factor on how much you can borrow. Or red if you've set a "Cash Available" which isn't high enough to satisfy the rental cover required.
Monthly Forecast

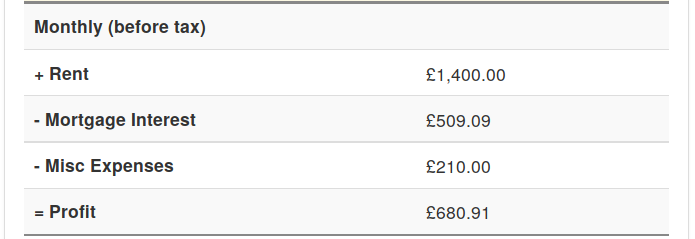
This is where it really starts to get interesting. The first figure should be familiar as it's just the forecast monthly rent that you entered. Let's look at each of the others.
Mortgage Interest
Nothing controversial here, just the monthly payment on your expected mortgage. Based on the interest rate you filled in and the calculated borrowing amount (see above).
Misc Expenses
This one could be a little more controversial. Trying to forecast expenses with buy-to-let investments is never straight forward. A lot of factors will make this vary, one of the main examples will be whether you use a managing agent, introduction agent or do it yourself. But it also depends on things like your level of insurance and how many voids you get. That's before we start thinking about single lets vs HMOs vs holiday lets.
Currently our buy-to-let profit calculator rolls this all up into an (evidence based) educated guess based on single lets.
This expenses figure shown will be 15% of the expected rental income.
Profit
Back to being simple - this is just your monthly rent minus mortgage, minus expenses.
Annual (and Yield) Forecast

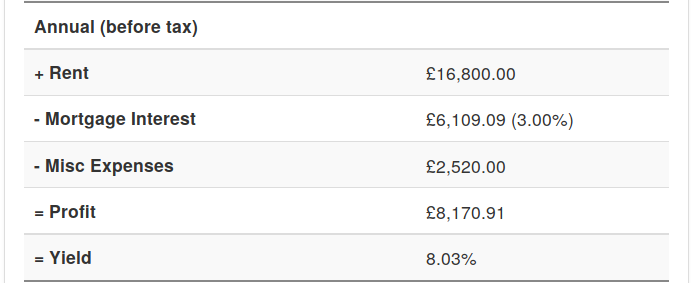
This section mostly saves you multiplying the previous section by twelve. The "Rent", "Mortgage Interest", "Misc Expenses" and "Profit" all have the same meaning as in the monthly forecast but multiplied by twelve to cover a whole year.
Yield
Yield is normally calculated as an annual figure and hence it makes an appearance in this section.
This yield is calculated using the "Profit" returned from the "Total Investment" you're putting in.
Looking to the Future!

A lot can change in five years and you should only treat this section as a quick guide. We don't take into account any rent rises or changes to your mortgage interest rate. We don't consider any value improvement from building or repair works. And we do assume a flat capital value increase of 3% per year. So in summary - these numbers will be wrong!
We still find these numbers can be useful though and hope that you do too.
Mortgage Interest Tax Changes Forecast

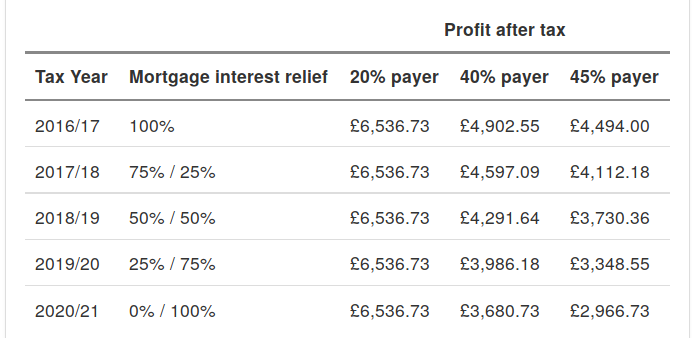
Last, but very definitely not least is an exceptionally important set of numbers for all higher rate tax payers. Hopefully you already know about the changes to mortgage interest tax relief that started to take effect this year.
All the buy-to-let profit calculations so far have been pre-tax. But there's a massive change happening over the next few years in how landlords will be calculating their tax so you should always look at this part of the results. A property that turns a nice profit today could potentially be making a loss (after tax) in a few years time.
To read these results, pick the column that matches the tax band that you're in and read down those numbers. These are the amounts you can actually expect to put in your pocket.
You can also hover your mouse over any of the post-tax profit figures to see a little extra detail.

Try it now
You can quickly and easily get all these figures for your next buy-to-let investment right now with our free buy-to-let profit calculator.
If you're planning to remortgage your existing investment properties or perhaps just wondering about what the tax changes will mean for you try our free buy-to-let remortgage calculator.


